Purpose
This note explains how the local heat transfer coefficient changes as a fluid boils while flowing through a heated tube.
The physical processes involved in flow boiling are more complex than those in single-phase forced convection. Heat transfer is influenced not only by the motion of the fluid, but also by phase change, bubble formation, changing flow patterns, and the amount of liquid remaining on the tube wall.
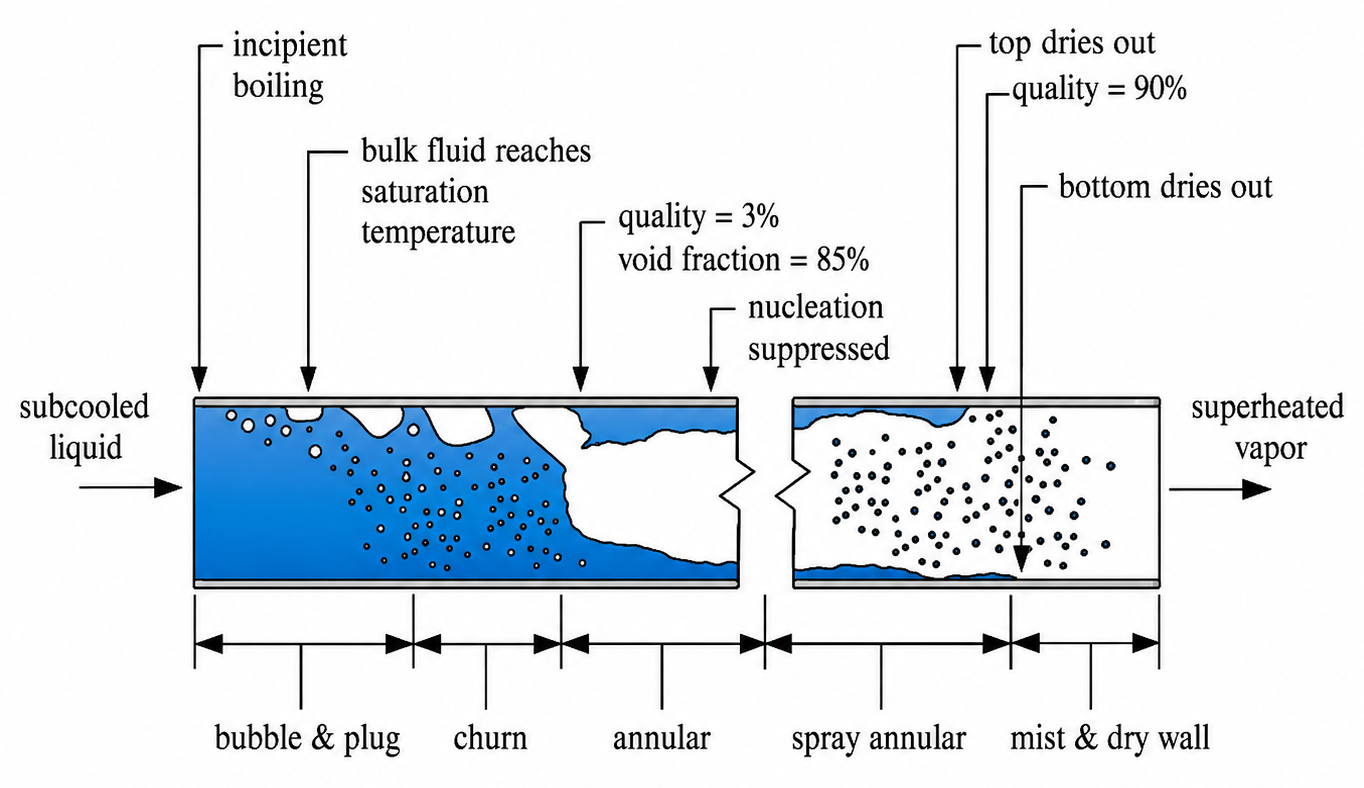
Flow boiling combines forced convection with phase change. The fluid may enter as a subcooled liquid, reach incipient nucleate boiling at the wall, form an annular liquid film, approach dryout, and finally leave as superheated vapor.
The heat transfer coefficient must therefore be evaluated alongside the flow regime. Vapor quality (x) is the vapor mass fraction. Void fraction is the proportion of tube volume occupied by the vapor phase. Because vapor is much less dense than liquid, even a low value of x can correspond to a high void fraction and significantly alter the flow pattern.
Physical Picture
Consider a subcooled liquid flowing through a horizontal tube whose wall is hotter than the saturation temperature. Near the inlet, incipient boiling can begin at the wall even while the bulk liquid temperature remains below saturation.
The moving liquid carries the bubbles downstream. As the bulk fluid reaches saturation, vapor quality increases and the bubbles occupy more of the tube. The figure shows that a quality of only 3 percent can correspond to a void fraction of about 85 percent for the illustrated case.
Gravity also affects the flow in a horizontal tube. At low void fraction, bubbles tend to collect near the top while liquid remains near the bottom. If the vapor and liquid velocities are low, the phases may separate into a stratified flow, with vapor above the liquid.
Flow Regime Development
As more vapor forms, bubbles join and the flow pattern changes. A typical progression is bubble and plug flow, churn flow, annular flow, spray annular flow, and finally mist flow with a dry wall. The exact sequence depends on mass flux, heat flux, fluid properties, tube size, and orientation.
At low mass flux, buoyancy can keep the phases partly separated. At higher velocities, waves form at the liquid vapor interface and may grow into liquid slugs. Wall wetting then changes with time, so the local heat transfer coefficient can also vary.
In annular flow, a liquid film covers the wall and vapor moves through the center as a core. Heat transfer is often high because nucleate boiling at the wall and convective evaporation from the liquid film can occur together.
The balance between these mechanisms changes as vapor quality increases. Nucleate boiling can dominate near the start of the saturated boiling region. Farther downstream, the liquid film becomes thinner, convective boiling becomes more important, and nucleation at the wall may be suppressed.
At moderate mass flux, gravity makes the annular film thinner at the top of the tube and thicker at the bottom. At high mass flux, stronger vapor shear spreads the liquid more evenly around the wall, so gravity has less influence.
Dryout and Heat Transfer Degradation
As boiling continues, evaporation and droplet entrainment make the annular film thinner. Eventually there may not be enough liquid to wet the entire wall. This is the beginning of dryout. In a horizontal tube, the top usually dries first because the liquid film is thinner there.
Dryout is important because liquid contact cools the wall more effectively than vapor contact. When the liquid film disappears, the wall temperature can rise sharply and the heat transfer coefficient can fall. Dryout is one of the mechanisms that can lead to a critical heat flux condition in flow boiling.
Near the end of the evaporating section, the remaining liquid may travel as droplets in the vapor core. The flow then approaches a spray annular or mist pattern. Liquid is still present, but it no longer forms a continuous film that can cool the wall effectively. Heat transfer after dryout requires a separate model.
Shah Flow Boiling Correlation
The Shah correlation is a widely used engineering method for estimating heat transfer during flow boiling. It considers both bubble formation at the heated wall and evaporation caused by the moving flow.
The balance between these effects changes as more of the liquid becomes vapor. The Shah method accounts for this change through the vapor content, heating level, flow rate, fluid properties, and the effect of gravity. It can therefore describe a wide range of boiling conditions without requiring a detailed flow pattern map.
The figure below shows a calculation for carbon dioxide at 32 barA and several mass flux values. Mass flux describes how much fluid passes through a given tube area. A higher mass flux usually improves heat transfer because the flow moves and mixes the liquid film more strongly.
The small step near x = 0.18 appears because the Shah method changes from one calculation range to another at this point. It is a feature of the correlation and does not mean that the physical boiling process changes suddenly.
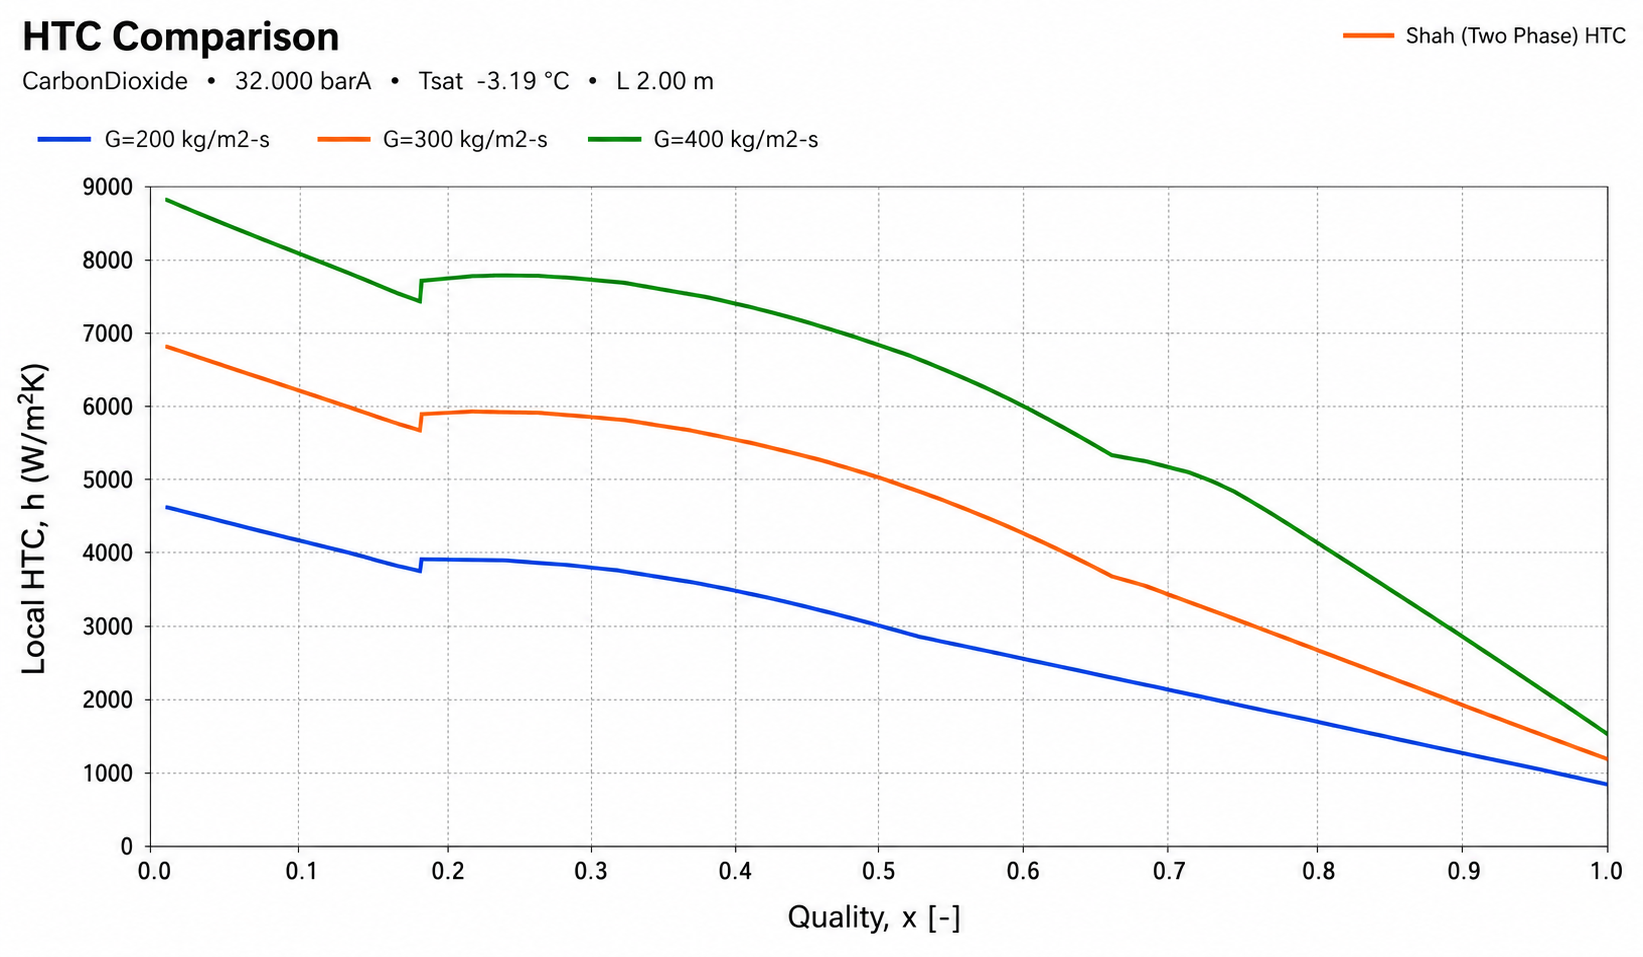
The graph shows that a higher mass flux generally produces a higher heat transfer coefficient. Each curve gradually falls as vapor quality increases and less liquid remains available to cool the wall. The later change in slope appears at a different point on each curve as the calculation moves from boiling toward vapor heat transfer. It shows the change in the predicted trend rather than the exact point of dryout.
Hundreds of correlations have been proposed for flow boiling. Literature comparisons have found the Shah method to be one of the most consistent against a broad range of experimental data, with a mean deviation below 20 percent. It was developed for saturated flow boiling below critical heat flux and can be applied to both horizontal and vertical flow.
The correlation covers a wide range of vapor quality, from saturated liquid to conditions where too little liquid remains to cover the wall. These liquid deficient and dryout conditions are generally associated with vapor qualities of about 0.8 or higher.
The value below 20 percent describes the average difference across many measurements, not a fixed error limit for every case. Some fluids and operating conditions can show larger differences, and carbon dioxide is one example where accuracy may vary. The graph should therefore be used to understand the overall trend rather than as a guarantee of exact values.
Taken together, the flow patterns and the heat transfer curves show how boiling changes along a heated tube. Bubble formation first supports strong heat transfer, the liquid film then becomes the main path for cooling, and dryout weakens heat transfer as vapor takes over. The Shah correlation provides a practical view of this overall development while the physical flow description explains why the coefficient changes from one region to the next.